Using CartoBuilder As a TARDIS For Exploring Geologic Relationships
If you're a Dr. Who Fan I apologize for the potential clickbait but geoscientists also frequently have to navigate the space-time continuum, sadly without the luxury of a time machine. However after receiving a few emails from CARTO I finally decided (and had the time) to take CartoBuilder for a spin and I think some of the new functionality could be used in interesting ways to help teach geologic concepts and relationships. After watching the introductory video on widgets I immediately wondered how CartoBuilder could be used to explore the recent earthquake swarms in Oklahoma. A number of studies (including this nice summary) have concluded the increase in seismicity is linked to subsurface fluid injections associated with increased fracking activities. However it's pretty difficult (Google's results aren't compelling) to find a nice looking map summarizing this seismic anomaly. The only visual I really liked was created by Dan Nguyen who used a nice Tufte-inspired, small mutiples approach:
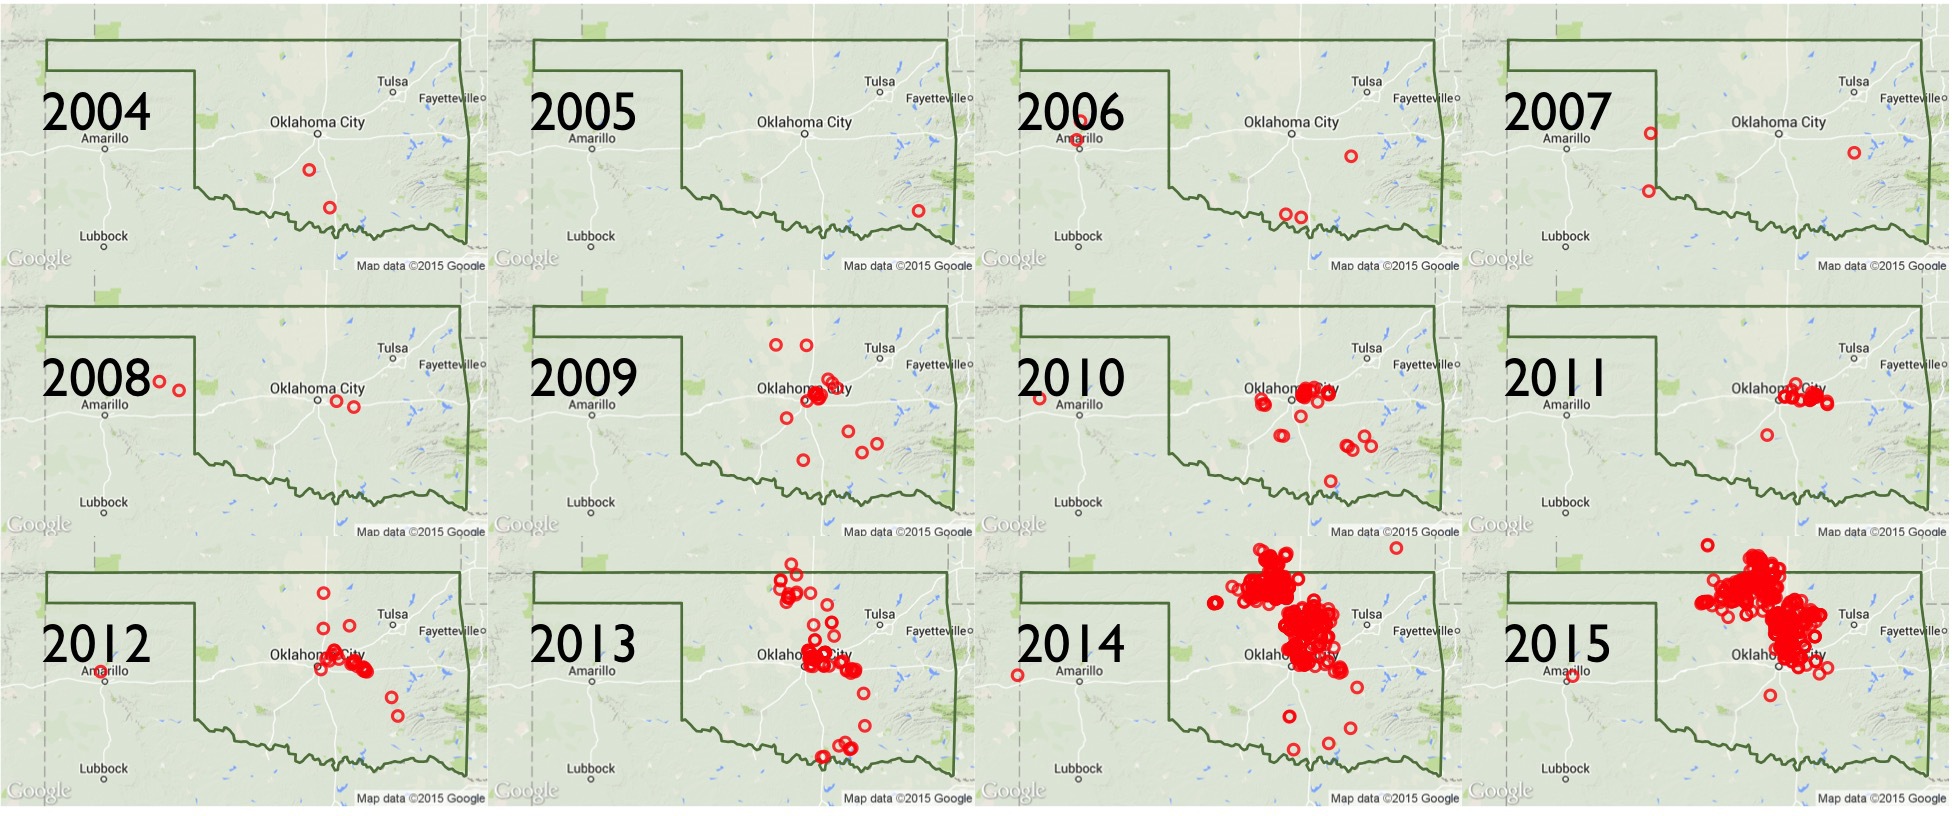
Source: http://blog.danwin.com/oklahoma-earthquakes-r-ggplot2/
If you're interested in teaching or exploring your own data with R, Dan also provides a nice Github repository with all the necessary code and R notebooks to explore how he created both this image and his earthquake animation. For research purposes there's no question R has a more extensive suite of user-supported packages and is without question more customizable, but for out-of-the-box simplicity in teaching environments I think CartoBuilder is really exciting.
Unfortunately I didn't discover Dan's repo until after I finished my map or I would have used some of his data. To create my map I used the following data:
- I used the USGS Earthquake Catalog to download all the earthquakes within Oklahoma since 1980 of magnitude 1.5 or greater, which resulted in this CSV file.
- I downloaded and merged shapefiles of the gas/oil plays from the Energy Information Administration.
- I downloaded shapefile from the Oklahoma Geological Survey depicting faults.
- I used a file of gas/oil wells I already had from a previous project

NOTE: Click here or on the map to view in a new window. The layout works better in a full-size window rather than as an embedded element.
In the static map above you can see the earthquakes as orange dots and since the timeline widget below the map is using a date field within the earthquake table, the vertical bars are also orange. There are three widgets on the right side of the interface: total earthquakes, earthquake magnitude, total wells, and play name. You can filter the map results by highlighting data of interest within the timeline, magnitude and/or play widgets. For example you could isolate only those earthquakes that happened between 2009 and 2015 or only those earthquakes with a magnitude greater than 3.0 or combine those two selections to focus in on the recent seismicity of concern. I included the play name widget to demonstrate the ability to include and symbolize categorical data but also overlay drilling operations with known fault systems. The really cool thing about widgets in CartoBuilder is they are included with your final map so that others can explore the data you want to share. This is pretty similar to the shareable Dashboards in Tableau, but in my opinion easier to create and share.
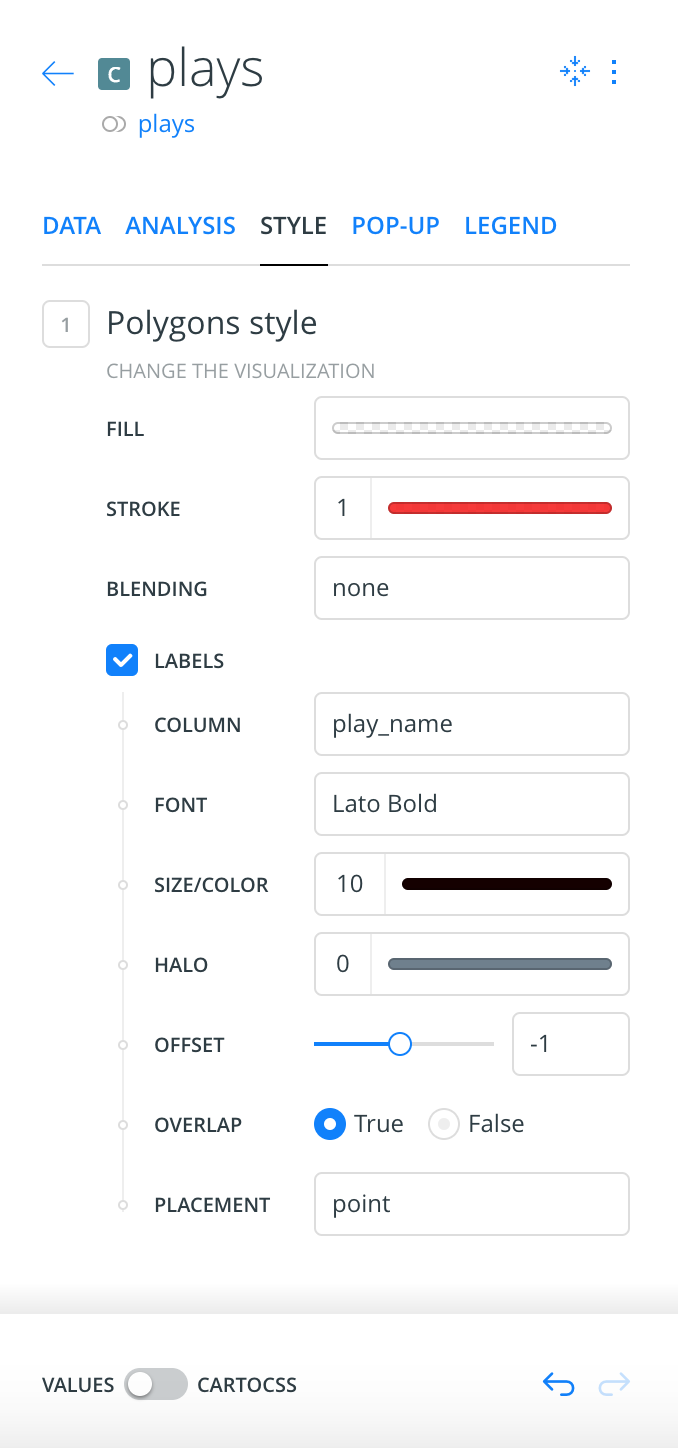
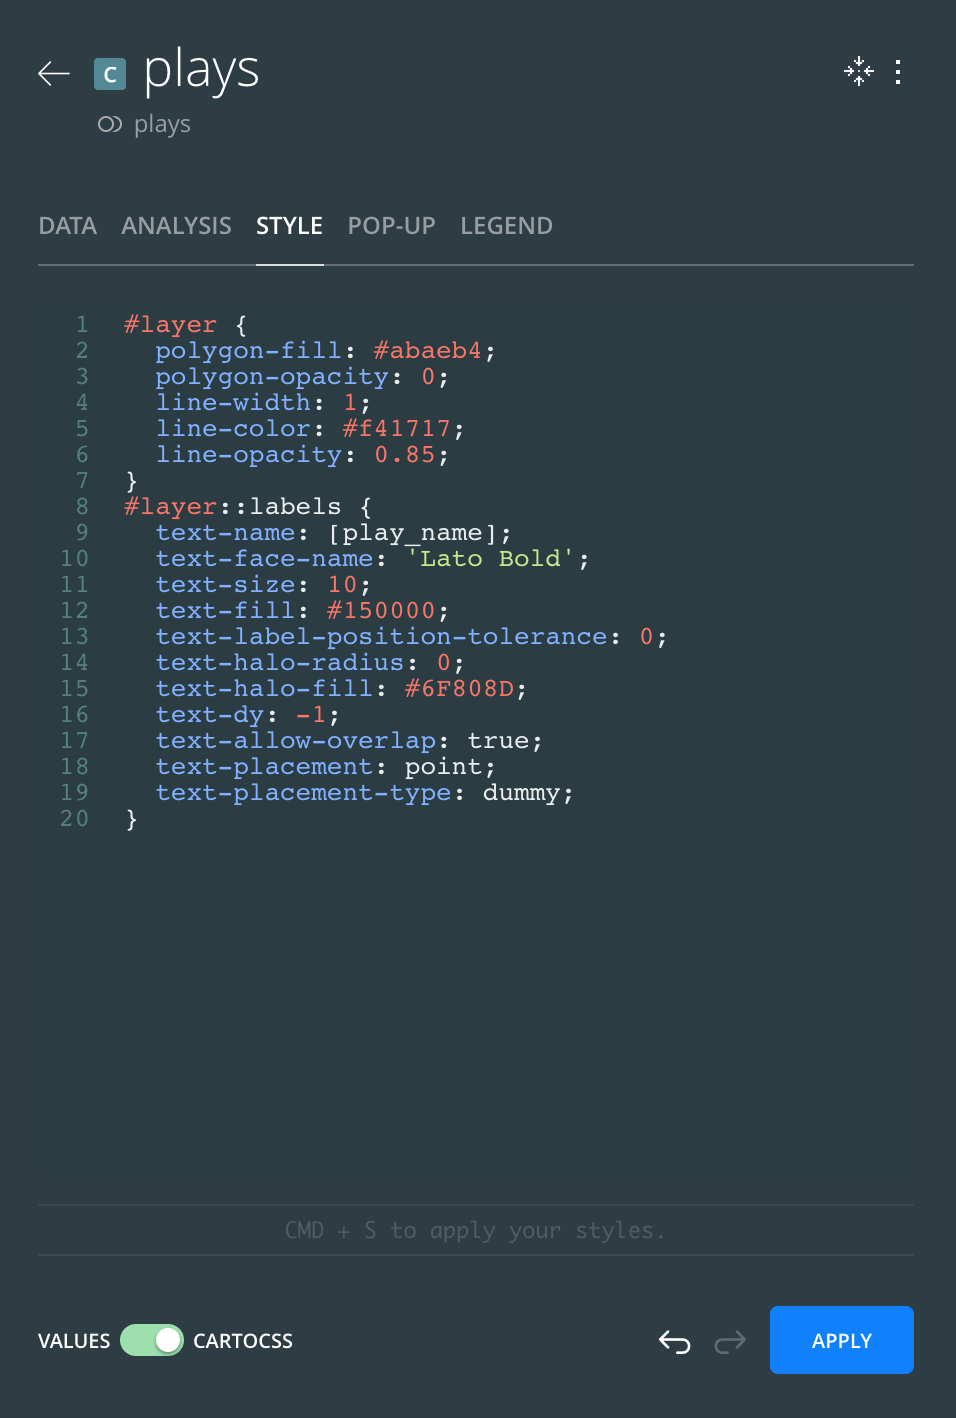
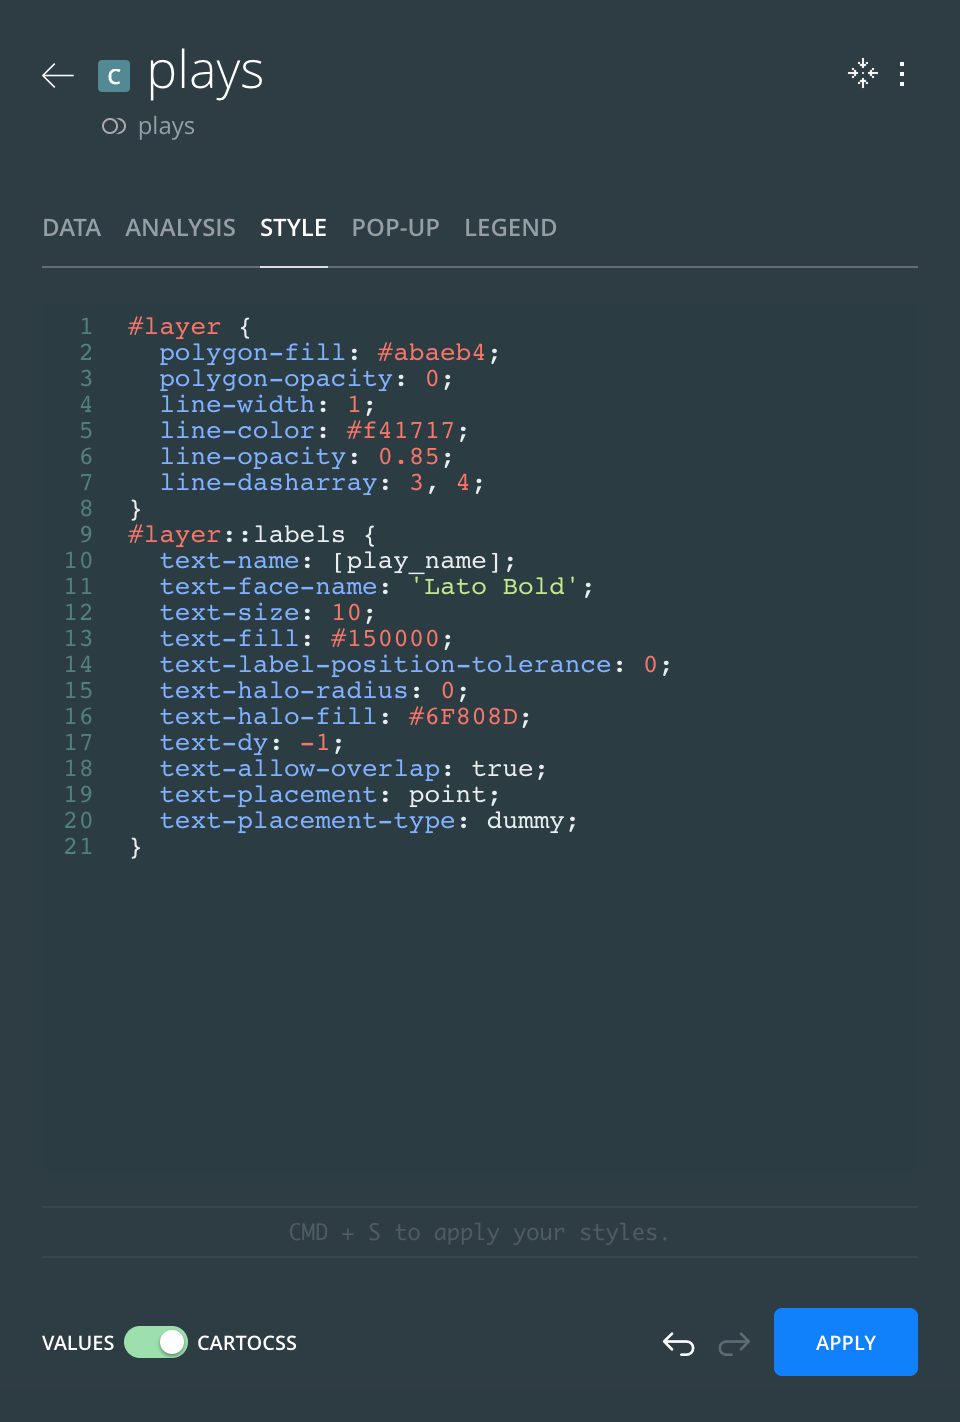
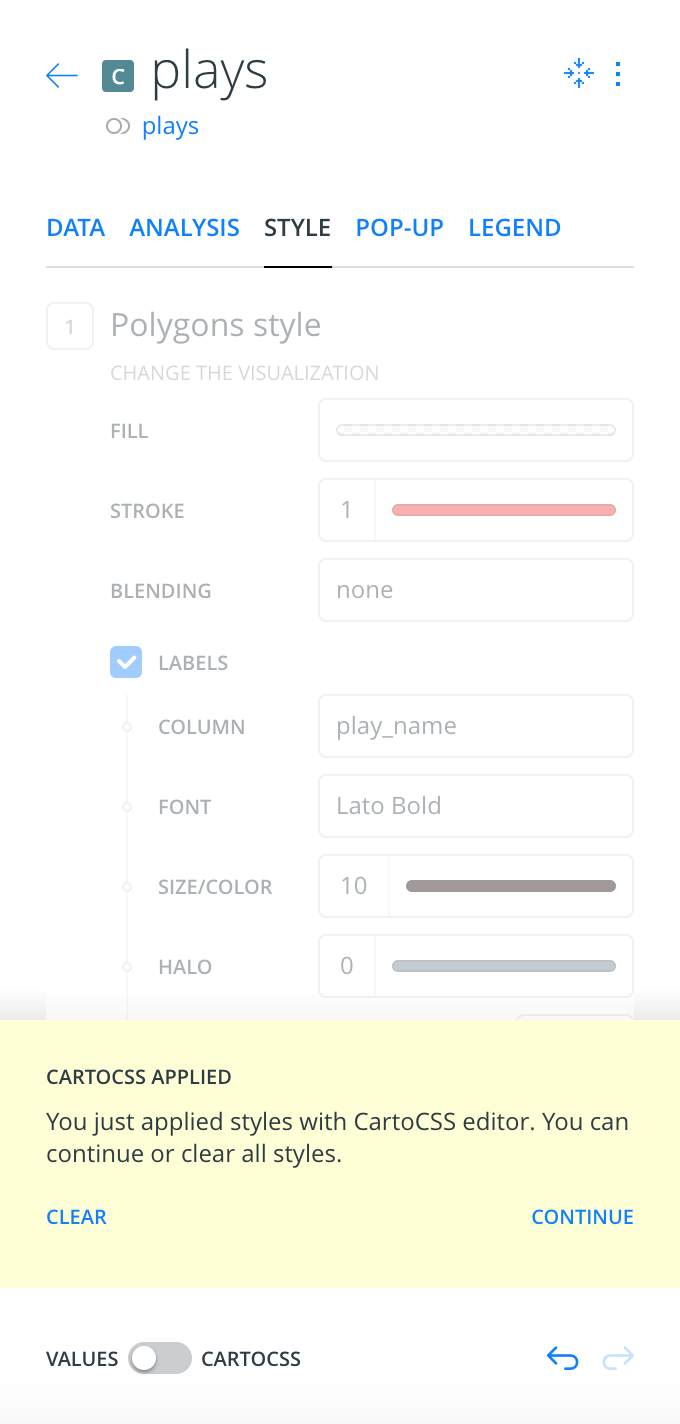
Another nice feature is the ability to reveal the underlying SQL and CartoCSS syntax in most of the panels - it doesn't appear possible yet to expose the CARTO.js used to create widgets. From a teaching perspective this is a great way for learners to explore and tinker with the code in a stable sandbox. But it is also useful for greater cartographic control over your map features. For example, since the oil and gas plays aren't an integral part of this story, I wanted them to have dashed lines so they were less obtrusive. To accomplish this I switched into the CartoCSS editor (lower left corner in the first image) and added a line-dash-array property to the layer symbology (second and third images). The only disadvantage is once you opt into the editor environment you need to stay there or reset all your changes (fourth image) - so you're no longer using the WYSIWYG interface. I don't think this is a real issue other than potentially slowing down new users unfamiliar with CartoCSS. But if you're a frequent user of halos or patterns, you'll quickly be switching to this Sublime-esque environment.
It's pretty easy to imagine the variety of inquiry-driven discussions we could jump start using the CartoBuilder TARDIS. Ultimately the bottleneck is finding relevant and sanitized geologic data. However it's worth the extra effort because in addition to exploring geology over space and time, geology students would also develop greater fluency with geospatial concepts and be required to navigate common syntax used to query and visualize spatial data. TheSQL statements used to filter or join data in the CARTO environment are transferable to desktop PostGIS environments. Most importantly for introductory courses, all of this is performed relatively easily compared to a full-blown GIS or by using Python or R. The Torque animation below (pretty similar to Dan's version) was created using the same earthquake data and CartoBuilder in under 5 minutes.
I'm developing another interface to help explore geologic relationships using the new analysis tools available in CartoBuilder. In my preliminary testing though, the underlying PostGIS engine supporting these cloud-based analyses is blazing fast compared to other... um, "competitors." I have shared my opinion about using PostGIS before to explore geologic relationships and I think the installation and database management required of a typical desktop setup may be a factor in seeing a slow adoption but CARTO offers painless access (both GUI and command line) to this powerful tool.
Header Image Source: http://j-vh.me/2ghv2Dr